
A reference page on which wearable numbers are read by a sensor and which are produced by a model, how large the error is on each, and the two that deserve a place in a week.
Short version first. A consumer watch or ring is good at telling when you slept, and good at following your pulse. It's loose on heart rate variability. Sleep stages, readiness and recovery scores, stress graphs and VO2 max are all calculated from those few inputs, and the size of that calculation's error is nowhere on the screen.
What follows is the long answer, study by study, with the limits of each study spelled out and the full source list at the end, while a shorter and more personal telling of the same argument runs on Substack. I sleep with a ring on and train with a watch, and have done for years, so some of what's below is my own data, and I'll say where.
Key points
-
Sleep timing is measured well. In a laboratory test of six devices, each one separated sleep from wake correctly for 86 to 89 percent of the night, scored in thirty-second slices, which is why the researchers called all six valid for when and how long you sleep.
-
Overnight heart rate is measured well too: four of the six tracked the ECG with intraclass correlations of 0.85 or better.
-
Heart rate variability is measured loosely. For the typical device, the limits of agreement with an ECG stretched 55 to 77 milliseconds.
-
Sleep stages are inferred without the brain signal that defines them, partly from built-in assumptions about when in the night each stage usually happens.
-
None of the makers behind fourteen reviewed composite scores disclosed how the score is calculated.
-
Exercise-based VO2 max estimates are close on average across a group and can miss one person by about 10 ml/kg/min.
-
Two numbers are worth your attention: the spread of your sleep midpoint across a week, and resting heart rate against your own normal.
This is an educational and strategic perspective, not personal medical advice.
The views are the author's own and not statements by Atlas Cove Lda.
The short answer: measured against calculated
Every number on a wearable starts from one of four raw streams, which are an accelerometer for movement, an optical sensor for pulse, a small thermometer resting against the skin and a clock, and anything the screen shows beyond those four is the output of a model that is only ever as good as the people it was trained on. Everything else is arithmetic.
So the useful question for any figure on the app is which stream it came from and how many steps of arithmetic sit between the sensor and the display, and bedtime, wake time and pulse come out after one step. A deep sleep total, a readiness score or an aerobic capacity estimate come out after several, and each step adds error you can't see. A number that took one step deserves more trust than one that took five, whatever the typeface says.
That's the whole claim, and it's narrow on purpose. Nothing here says the devices are bad. On the parts they actually sense, they're better than the research tools that came before them.
What the sensors get right
The optical sensor is the interesting one. It shines green light into the skin and reads how much comes back, which changes with every pulse as the small vessels underneath fill and empty, and the technique, photoplethysmography, works on the same principle as the clip a hospital ward puts on your finger. Getting a heart rate out of it takes almost no modelling.
The cleanest test I know is Miller and colleagues, who fitted fifty-three young adults with six consumer devices for a single night in a sleep laboratory, alongside full polysomnography and an ECG (Miller et al., 2022). Four devices sat on the wrist, one was a ring and one was an adhesive patch on the forehead with electrodes of its own, and when the night was scored in thirty-second periods every one of them got sleep versus wake right between 86 and 89 percent of the time, which is why the authors called all six valid for when and how long someone sleeps. For heart rate through the night, four of the six agreed with the ECG at intraclass correlations from 0.85 to 0.99. Pulse is the easy part.
The broader literature agrees. A 2024 state-of-the-science review concluded that current consumer devices assess sleep, measured against the laboratory, better than the traditional research actigraphs the field used for decades (de Zambotti et al., 2024).
There's one soft spot inside that good result, and it matters later. Every device in Miller's study caught more than nine in ten sleep periods, but the share of true wake it recognised as wake ran from 26 to 57 percent across the wrist and finger devices. Chinoy and colleagues found the same shape with a different set of seven consumer trackers over three laboratory nights: sensitivity for sleep of at least 0.93, specificity for wake between 0.18 and 0.54 (Chinoy et al., 2021). Lying still and awake looks a lot like sleeping to an accelerometer. Short stretches awake in the night are the part most often missed.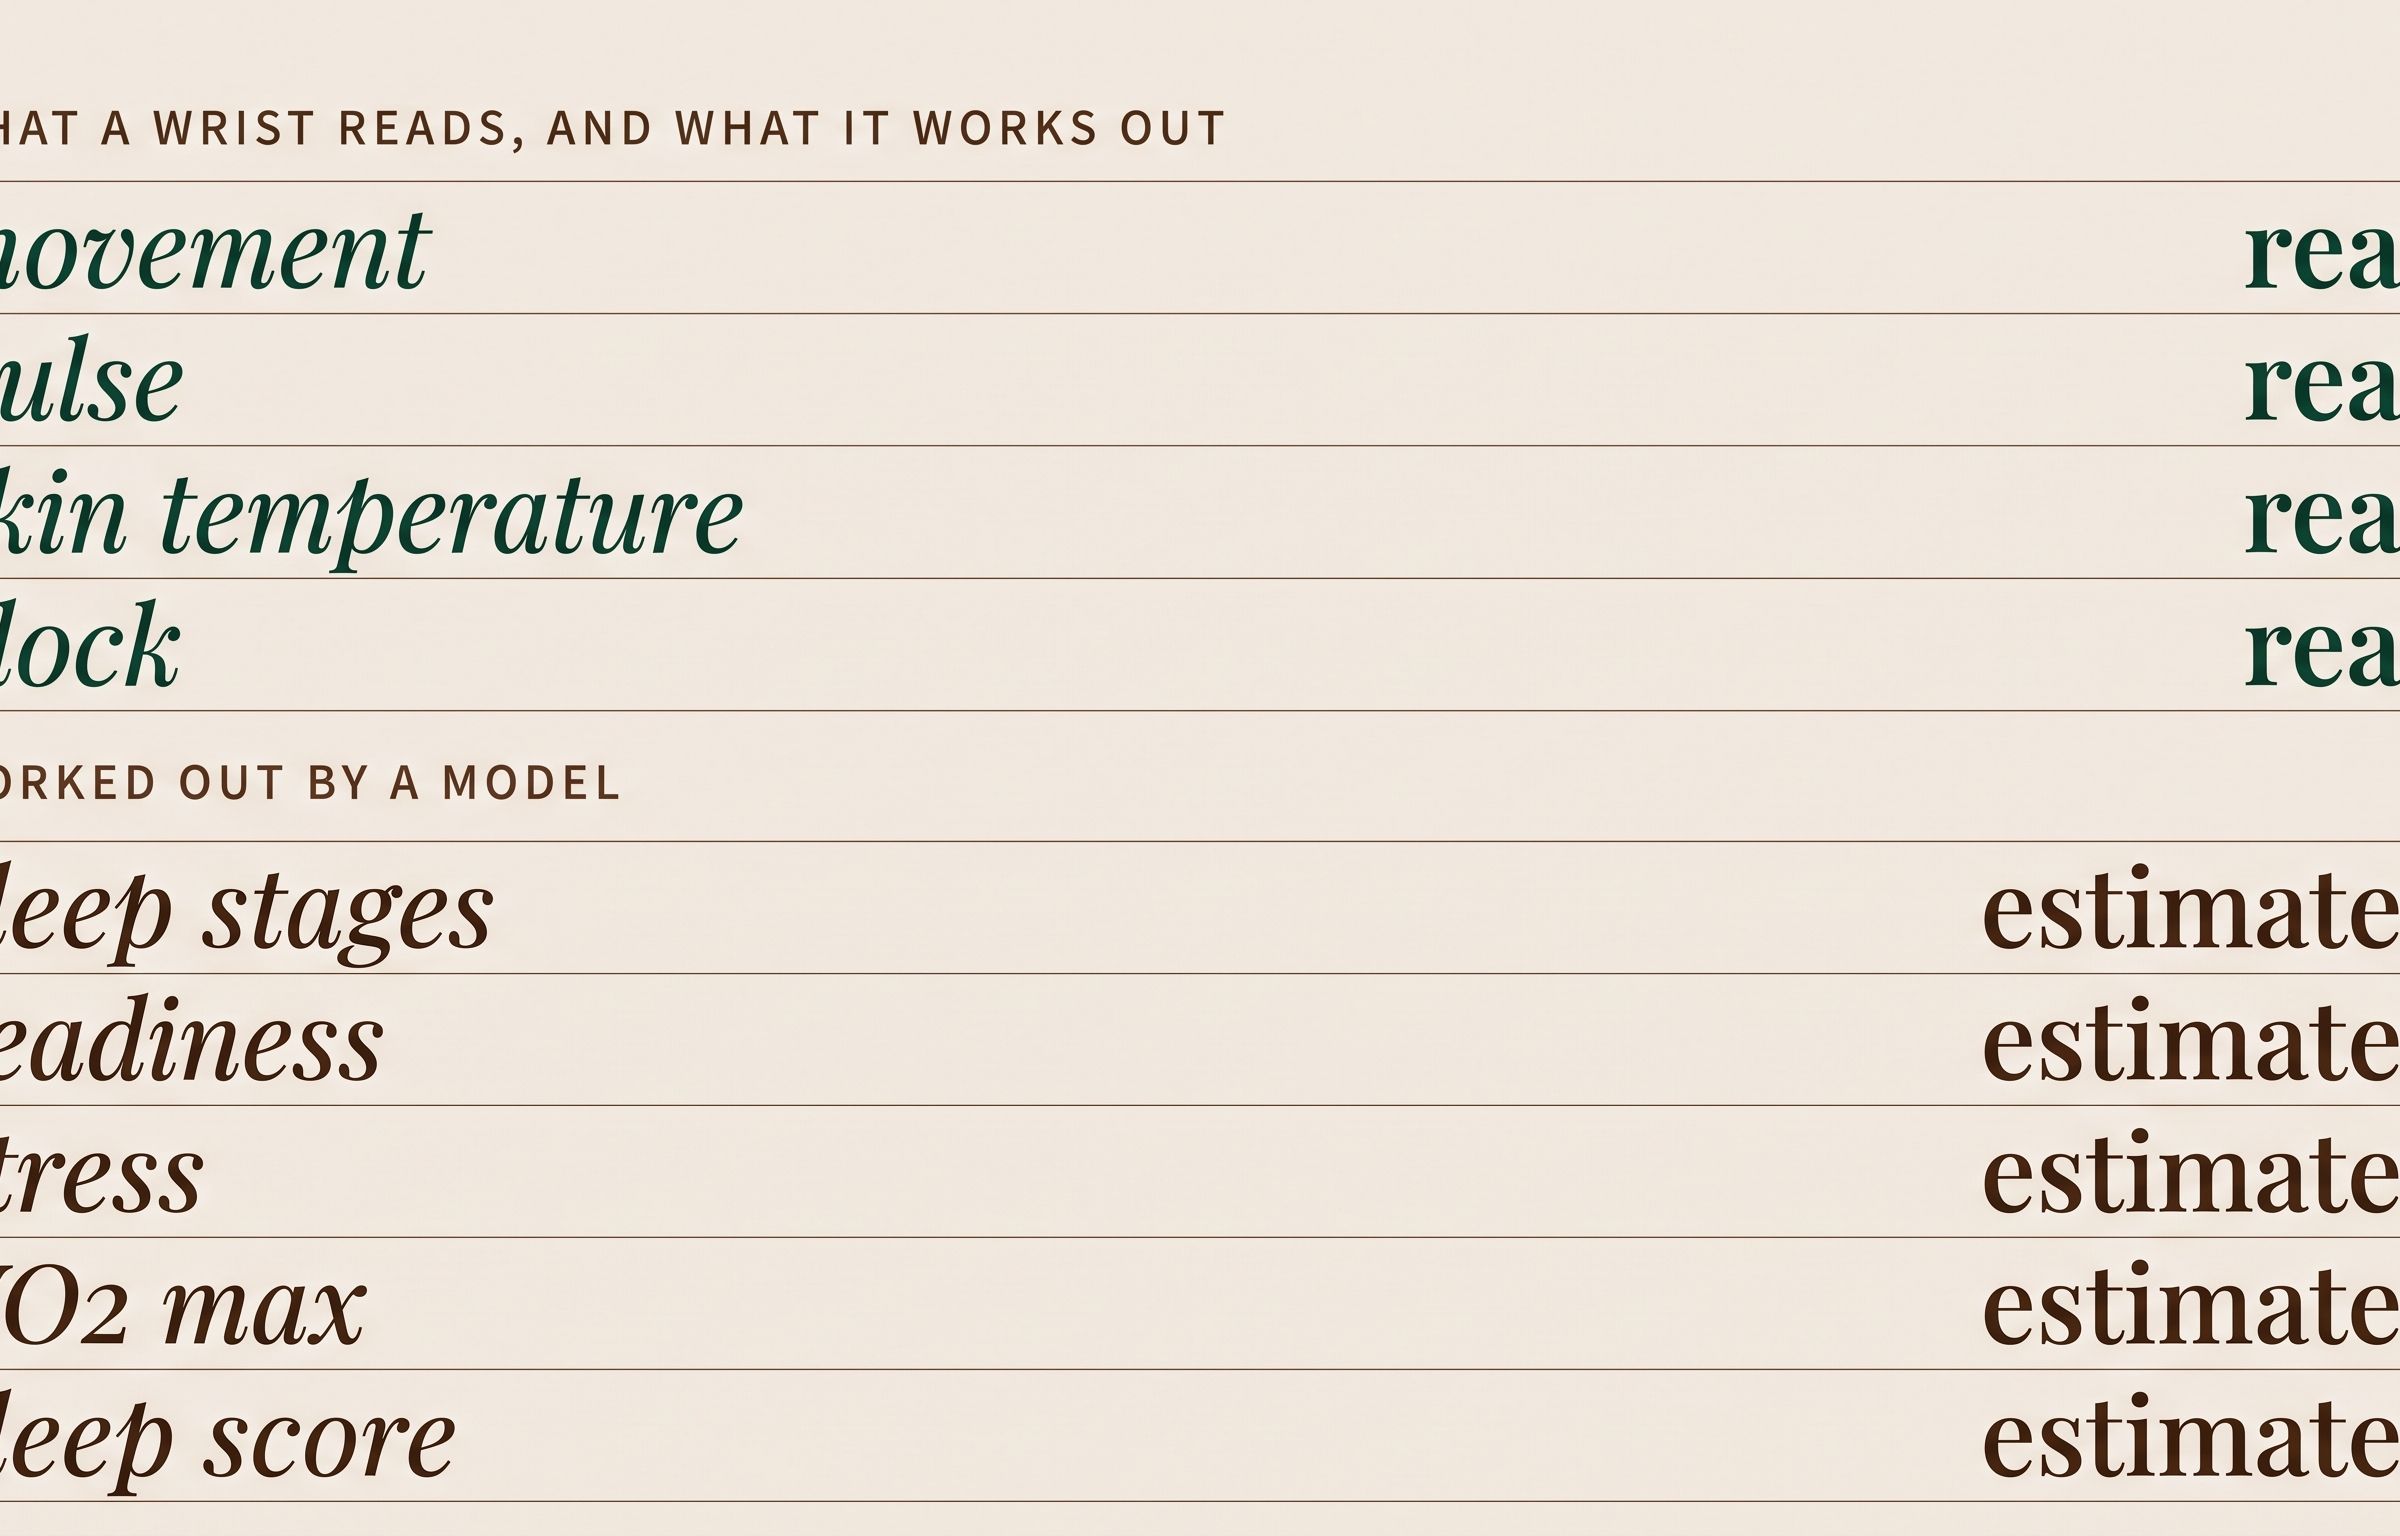
Heart rate variability, the loosely measured one
Your heart doesn't beat like a metronome. The gap between two beats stretches and shrinks, a few milliseconds at a time, largely because the vagus nerve applies and releases a brake on the heart with each breath and with your general state. Heart rate variability is a summary of that wobble, and the most common summary is rMSSD, the root mean square of the differences between successive beat intervals. At rest and during sleep it's widely read as a window on parasympathetic activity, and the ring study discussed below computed it over one-minute and five-minute windows precisely to catch fast parasympathetic changes (Altini and Kinnunen, 2021).
HRV is fussier. A pulse rate survives a few blurred beats. A measure built from the differences between individual intervals doesn't, so an optical sensor has to throw out any interval it isn't sure of, and the ring paper kept an interval only when the two before it and the two after it also looked clean. Miller's six devices didn't even agree on the window: some reported HRV over the whole night, one over four-hour blocks, one from a three-minute test you start yourself.
The result in that same laboratory night was moderate. Four of the six devices matched the ECG on HRV at intraclass correlations of 0.63 to 0.69, and their limits of agreement ran to roughly 55 to 77 milliseconds either side, a band wider than most of the day-to-day changes people read meaning into when they open the app in the morning. One device reached 0.99. It did so on raw data its manufacturer supplied to the researchers, which is not what the app on your wrist shows you.
HRV from a wrist or a finger is an indicator, and a single morning's value carries very little on its own. I've always read mine that way, as one line among several, and the validation data gives me no reason to promote it.
How a watch estimates sleep stages without a brain signal
In a laboratory, a sleep stage is a definition applied to brain activity. A technician reads electrical signals from the scalp, eye movements and muscle tone in thirty-second slices, and deep sleep is the name for a pattern of large, slow EEG waves, and since a wrist device has none of those inputs, every stage it reports is a prediction made from movement, pulse, temperature and time.
Walch and colleagues published how such a prediction can be built, openly, on an ordinary consumer watch and thirty-one healthy sleepers (Walch et al., 2019). Motion on its own was the weakest predictor for separating REM from non-REM. Heart rate added a lot. Then came a third input, which the authors named a clock proxy: a curve approximating the circadian drive to sleep across the night. With all three inputs the model separated wake, REM and non-REM correctly about 72 percent of the time.
Altini and Kinnunen, both working with the manufacturer of the ring I wear, went further on 440 nights from 106 people and reported every step (Altini and Kinnunen, 2021). Accelerometer alone got four-stage classification right 57 percent of the time, adding temperature lifted that to 60, and adding heart rate variability took it to 76, which is where most of the gain sits. The final three points, up to 79, came from what they call sensor-independent features: a cosine standing in for the circadian rhythm, an exponential decay standing in for sleep pressure, and a line rising from zero to one across the night, all three added to tell the model that deep sleep usually comes early and REM late. I enjoyed reading that paper more than I expected to, because it says plainly what most product pages leave out.
That result deserves credit. A score of 79 percent is close to what two trained human scorers achieve against each other on the same recording, which the paper puts at 82 to 83, and on an ordinary night that is good engineering.
Miller's per-stage tables show where the hard part sits. Of the thirty-second periods the laboratory scored as deep sleep, the four wrist and finger devices that report deep sleep separately also labelled between 28 and 62 percent as deep, and for REM the same four devices got between 49 and 66 percent. Counting every stage and wake together, the wrist and finger devices agreed with the laboratory 50 to 61 percent of the time. The forehead patch, the only device reading brain signals directly, reached 65 percent overall and caught 68 percent of deep sleep. The device with the brain signal did best on the stage that is defined by the brain signal, which is about what you'd expect.
Why the untypical night is the weak spot
Look at who these models learned from. Walch's group excluded people with insomnia, shift workers and anyone who had crossed more than two time zones in the previous month, and in their own limitations they wrote that performance could fall in insomnia, because the method relies on a normally behaving autonomic system. Altini and Kinnunen trained on healthy sleepers too.
Chinoy's design tested the other end directly. One of each participant's three laboratory nights was deliberately disrupted, broken up the way a poor night breaks up, and the trackers did worse on those nights. The authors ask for the devices to be tested in other populations and settings before anyone stretches the results further.
Putting those findings side by side is my step, not something either study tested: a model that leans partly on where stages usually fall in a typical night should be least reliable on exactly the night that isn't typical. That's the jet-lagged night, the night of a sick child, the night you lie awake at three. It's also the night you're most likely to open the app to understand.
The algorithms on sale are proprietary. I can't tell you that any particular product works like the two published recipes. What I can say is that both published recipes needed a clock to get their best result.
Watch VO2 max: an estimate with a wide band
My own watch gave me three readings across the build for Cascais, April 54.7, July 52.4 and October 51.6, a fall of 3.1 points over six months during which every other sign said the training was going well. I took it at face value. In July I nearly put interval sessions back into a plan with no space left for them, on the strength of that middle reading. The chest strap made the pulse data better. It didn't make the oxygen figure any less of a guess, because nothing on me ever measured oxygen.
The meta-analysis by Molina-Garcia and colleagues combined fourteen validation studies and set out how the two main families of estimate are built (Molina-Garcia et al., 2022). The exercise-based family logs a few personal details, age at minimum, records heart rate and speed during a run or ride, keeps the segments that look reliable, and derives VO2 max from how heart rate relates to speed. The resting family works from resting heart rate, heart rate variability, age, self-reported activity and a few other details you enter, with no exercise in the calculation at all.
On average the resting estimates came out roughly 2 ml/kg/min too high, with limits of agreement from roughly minus 13 to plus 17. The exercise estimates had almost no average bias, minus 0.09, but limits of agreement of about 10 ml/kg/min on either side, which is why the authors sum up exercise-based estimation as fine for describing a population and poor for describing any one person in it.
Ten points either way is more than three times the fall that nearly changed my summer. I read a watch VO2 max as a rough location now, and I don't read a direction into any change smaller than that band.
There's a serious counterargument. Agreement with a laboratory across many people is a different question from whether one device follows one person's changes faithfully, and a device that overestimated every user by four points could still follow each one's trend correctly. The meta-analysis doesn't test that, and I haven't found a study that does, so I treat it as open. The longer version of why VO2 max decides less about a long race than people think is in what VO2 max does and doesn't decide.
What a readiness or recovery score is made of
Doherty and colleagues looked at fourteen composite scores, drawn from ten manufacturers and covering readiness, recovery, strain, stress and energy (Doherty et al., 2025). Of those fourteen, 86 percent used heart rate variability as an input and 79 percent used resting heart rate. None of the makers disclosed the formula. Time windows and weightings differed between them and few could point to peer-reviewed validation, and since Altini, one of the five authors, is also first author of the ring paper, the criticism comes from inside the field rather than from anyone with a grudge against it.
So the typical score blends the loosely measured input with the well measured one, in proportions nobody outside the company can see, and returns two digits. I'm an engineer by training and that bothers me in a specific way: a figure built from a hidden recipe can't be checked, and so it can't be shown to be wrong. That's the whole objection. I stopped looking at mine some time ago, mostly because I noticed nothing I did changed when it moved.
The fair case for scores is real. One colour in the morning is simple, and for someone who would otherwise pay sleep no attention at all, being nudged toward bed at a reasonable hour does good even when the arithmetic behind the nudge is soft.
The risk shows up elsewhere. In Gavriloff's study, sixty-three people with insomnia wore a device and were then given invented feedback the next morning, randomly either a good night or a poor one (Gavriloff et al., 2018). Those told they had slept badly reported less alertness and more sleepiness and fatigue during the day, while on an objective vigilance test the two groups performed the same. That's people with insomnia, over one day, so it isn't a general law. It's still the clearest evidence I know that a sleep number can change how a day feels without changing what you're able to do in it.
It also means I have to correct something. In the first piece in this series I suggested following the weekly recovery trend a watch gives you. I'd narrow that now to the resting heart rate underneath the trend.
What is worth reading, and a six-week test
My own list is short. The ring answers four questions for me: how long I slept, the midpoint of the night and its drift over seven days, pulse and HRV as indicators, and whether I've been sitting for too long. The watch answers how far, where, and at what heart rate. Everything else on either screen I leave alone.
Start with the sleep midpoint. It's the halfway point between falling asleep and waking, and what matters is how far it wanders across a week. Regular timing carries unusually strong evidence: in a cohort of 60,977 people, Windred and colleagues found that the regularity of sleep was a stronger predictor of mortality risk than how long people slept (Windred et al., 2024). That's an association, and the authors are careful about cause. The raw material, though, comes from the clock and the accelerometer, the two parts a device reads best. Why timing carries so much weight is covered in sleep architecture, not sleep hours. Keep sleep length beside it, since you'll look anyway and the device gets it roughly right.
The second is resting heart rate, read against your own history. Quer and colleagues followed 92,457 adults in the United States wearing wrist trackers for a median of 320 days each, and between people normal resting heart rate differed by up to 70 beats per minute (Quer et al., 2020), so a population range tells you very little about yourself. Within a person the value was much steadier, with a small seasonal drift, and 20 percent of people had a week or more in which it shifted by at least 10 beats. Those are the weeks to notice. Quer's data don't explain them.
The test I'd suggest is free. Spend six weeks reading only those numbers and nothing else on the screen. Whenever you'd have wanted a score before a decision (a hard session, a late meal, another coffee), note the decision you made without one. At the end, go back through the list, mark each decision a score might have altered, and ask whether it would have been better for it. My guess is very few. I'd like to hear from anyone whose count comes out differently.
What the evidence says, measured against calculated
| Number | Measured or calculated | What the error looks like |
|---|---|---|
| Sleep onset, wake time, sleep length | Measured: clock and movement | 86 to 89 percent agreement; brief waking often missed |
| Overnight heart rate | Measured: optical pulse | ICC 0.85 to 0.99 on four of six devices |
| Heart rate variability | Measured, loosely | ICC 0.63 to 0.69; limits of agreement 55 to 77 ms |
| Sleep stages | Calculated from movement, pulse, temperature and time | 50 to 61 percent agreement, stages and wake together |
| Readiness, recovery, stress scores | Calculated, formula undisclosed | Unknown; few peer-reviewed validations |
| VO2 max, exercise-based | Calculated from heart rate and speed | Close on average; about 10 ml/kg/min either way for one person |
| VO2 max, resting-based | Calculated from resting data | Roughly 2 ml/kg/min too high on average; wider band |
Caveats, and what would change my mind
A page like this should be honest about where it's thin, so here are the limits, study by study.
-
The best validation data is young and healthy. Miller's volunteers averaged 25 years old and spent one night each in the laboratory; Chinoy's were healthy young adults too. A person in their fifties with fragmented sleep is not what these devices were tested on.
-
Devices and algorithms change. Firmware updates alter the models, so any single validation describes one version at one point in time. The ranking of measured over calculated has held across the studies here; the exact percentages will not.
-
Industry links run through the literature. Miller's group declares research support from one manufacturer, and both authors of the ring paper were affiliated with the company that makes it. Neither fact makes the results wrong. The ring paper is, if anything, the most open account of how staging works.
-
The score review is read from its abstract. The score review by Doherty and colleagues is cited here only for what its abstract states: the share of scores using each input, the absence of disclosed formulas and the scarcity of validation.
-
The sham-feedback result is narrow. Sixty-three people who met the criteria for insomnia, one day of feedback. It shows the mechanism is possible, not how large it is in everyone else.
-
Trend-following is untested, as far as I can find. A study that measured the same people's VO2 max in a laboratory and on a watch repeatedly over months would tell us whether a watch's direction can be trusted even when its level can't. That would change how I read my own three readings.
-
The untypical-night argument is an inference. It joins two findings; a direct test of staging accuracy on disrupted nights, stage by stage, with models trained on healthy sleepers, would confirm or break it.
Where Atlas Cove fits
The plainest numbers from Cascais are still the ones I trust most: heart rate 143 in the swim, 142 on the bike, 144 on the run, from a chest strap, held within two beats for more than eleven hours. No model was involved. The training log I kept that year tracked a single thing, hours, and had nowhere to record when I went to bed, which is a little embarrassing given where this page ends up.
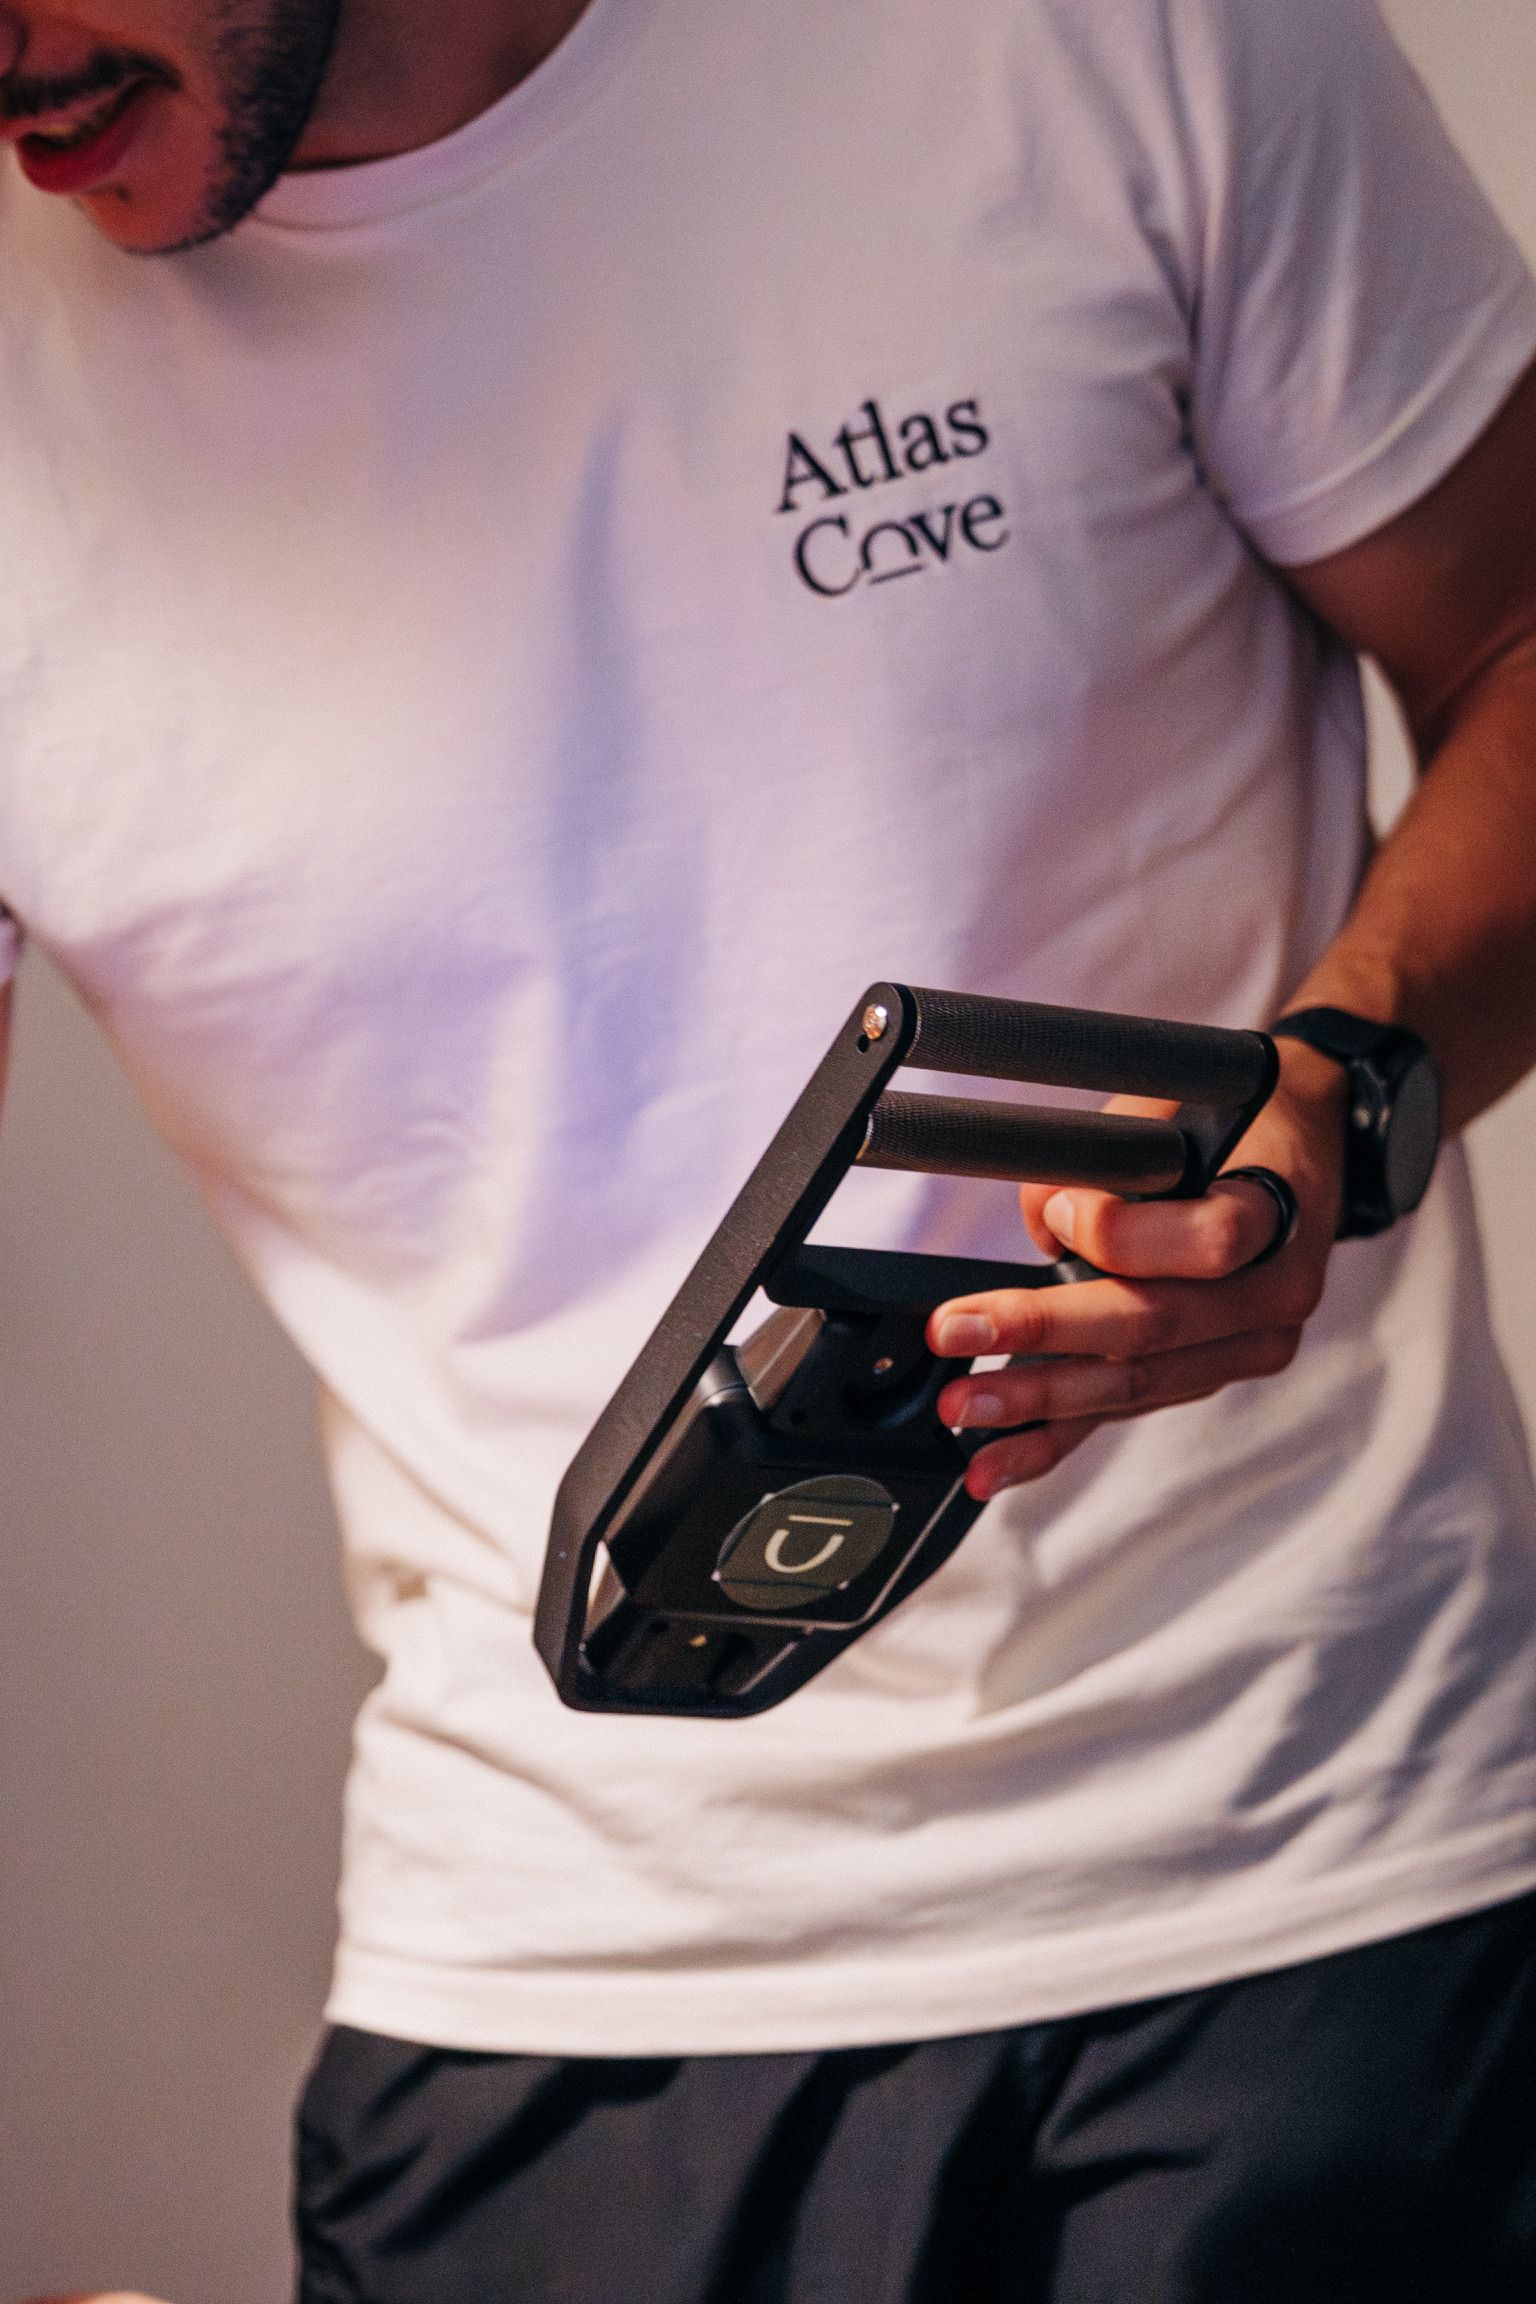
The first measuring week we hosted at Atlas Cove followed the same logic. The number that did most of the work came from a hand dynamometer: a spring, a dial and no model behind it. Grip strength helped each guest see whether the months ahead should lean toward strength, endurance or sleep, and because we measured it twice we also learned that it moves with the time of day, which is worth knowing before anyone reads meaning into a single value. Sleep data earned its place through timing alone: the midpoint of the night, the minutes it took to drop off, and whether someone woke at three or at five.
So an Atlas Cove week starts by measuring. Our hosts measure something only if they can say in advance what a high result and a low one would each change about your days. A number that can't pass that test stays off your page, which is the same rule set out in the article on lactate.
Common questions
Are sleep scores from a watch or ring accurate?
The timing behind them is. When you fell asleep and woke up is measured well, at 86 to 89 percent agreement with a laboratory in the best test I know. The score itself isn't. It's calculated from undisclosed inputs and weights, so nobody outside the company can tell you how accurate it is.
How accurate is deep sleep tracking on a wearable?
Loosely. In a laboratory comparison, wrist and finger devices labelled between 28 and 62 percent of true deep sleep as deep, because deep sleep is defined by brain waves they can't record. I'd read the nightly deep sleep total as a rough guess and never as a target.
Can I trust the HRV reading from my watch?
As a trend against your own normal, cautiously. Against an ECG most devices agreed only moderately, with limits of agreement around 55 to 77 milliseconds, so one morning's value says very little. A run of mornings moving in one direction says more.
Is the VO2 max on my watch correct?
On average across many people, estimates built from exercise are close. For one person they can be off by about 10 ml/kg/min either way, so I treat mine as a rough location and ignore changes smaller than that.
What should I track instead of a readiness score?
Two things: how much your sleep midpoint moves across a week, and your resting heart rate against your own baseline. Both come from what a device measures directly, and regular sleep timing has stronger evidence behind it than any composite score.
Sources
-
Miller, D. J., Sargent, C., & Roach, G. D. (2022). A validation of six wearable devices for estimating sleep, heart rate and heart rate variability in healthy adults. Sensors, 22(16), 6317. DOI: 10.3390/s22166317
-
Walch, O., Huang, Y., Forger, D., & Goldstein, C. (2019). Sleep stage prediction with raw acceleration and photoplethysmography heart rate data derived from a consumer wearable device. Sleep, 42(12), zsz180. DOI: 10.1093/sleep/zsz180
-
Chinoy, E. D., Cuellar, J. A., Huwa, K. E., Jameson, J. T., Watson, C. H., Bessman, S. C., Hirsch, D. A., Cooper, A. D., Drummond, S. P. A., & Markwald, R. R. (2021). Performance of seven consumer sleep-tracking devices compared with polysomnography. Sleep, 44(5), zsaa291. DOI: 10.1093/sleep/zsaa291
-
Windred, D. P., Burns, A. C., Lane, J. M., Saxena, R., Rutter, M. K., Cain, S. W., & Phillips, A. J. K. (2024). Sleep regularity is a stronger predictor of mortality risk than sleep duration: a prospective cohort study. Sleep, 47(1), zsad253. DOI: 10.1093/sleep/zsad253
-
Quer, G., Gouda, P., Galarnyk, M., Topol, E. J., & Steinhubl, S. R. (2020). Inter- and intraindividual variability in daily resting heart rate and its associations with age, sex, sleep, BMI, and time of year: retrospective, longitudinal cohort study of 92,457 adults. PLOS ONE, 15(2), e0227709. DOI: 10.1371/journal.pone.0227709
-
Doherty, C., Baldwin, M., Lambe, R., Burke, D., & Altini, M. (2025). Readiness, recovery, and strain: an evaluation of composite health scores in consumer wearables. Translational Exercise Biomedicine, 2(2), 128-144. DOI: 10.1515/teb-2025-0001
-
Gavriloff, D., Sheaves, B., Juss, A., Espie, C. A., Miller, C. B., & Kyle, S. D. (2018). Sham sleep feedback delivered via actigraphy biases daytime symptom reports in people with insomnia: implications for insomnia disorder and wearable devices. Journal of Sleep Research, 27(6), e12726. DOI: 10.1111/jsr.12726
-
Molina-Garcia, P., Notbohm, H. L., Schumann, M., Argent, R., Hetherington-Rauth, M., Stang, J., Bloch, W., Cheng, S., Ekelund, U., Sardinha, L. B., Caulfield, B., Brønd, J. C., Grøntved, A., & Ortega, F. B. (2022). Validity of estimating the maximal oxygen consumption by consumer wearables: a systematic review with meta-analysis and expert statement of the INTERLIVE network. Sports Medicine, 52(7), 1577-1597. DOI: 10.1007/s40279-021-01639-y
-
Altini, M., & Kinnunen, H. (2021). The promise of sleep: a multi-sensor approach for accurate sleep stage detection using the Oura ring. Sensors, 21(13), 4302. DOI: 10.3390/s21134302
-
de Zambotti, M., Goldstein, C., Cook, J., Menghini, L., Altini, M., Cheng, P., & Robillard, R. (2024). State of the science and recommendations for using wearable technology in sleep and circadian research. Sleep, 47(4), zsad325. DOI: 10.1093/sleep/zsad325
This is an educational and strategic perspective, not personal medical advice.
The views are the author's own and not statements by Atlas Cove Lda.
Tom Wuerden · Co-Founder
Engineer turned Ironman
Read next
Does lactic acid cause muscle burn and soreness? What the evidence shows
Lactate is a fuel your heart and brain burn. It does not cause the burn in your legs, and it is not why you ache two days later.
Sleep architecture, not sleep hours: what a shortened night actually costs
Cutting a night short does not cost every sleep stage equally. What the evidence says about deep sleep, REM, alcohol, caffeine and sleep trackers.
What actually moves your health baseline: measuring, resting or doing
Fourteen trials, 182,880 adults, no lives saved. What the evidence says about health checks, wearables, rest and the one number that answers to work.